Release notes
March 2026
🔧 Extended Idle Timeout for Panel Apps
Panel apps now support longer idle times for websocket connections, with session token expiration increased to 3 hours. New parameters for managing unused session lifetimes improve stability of long-running applications.
🔧 Plugin Variants Documentation
The new --plugin-variants flag in flyte gen docs generates variant-scoped CLI documentation. Plugin-contributed CLI commands are wrapped in Hugo {{< variant >}} shortcodes, so core commands appear unconditionally while plugin commands are shown only in specified variants (e.g., byoc, selfmanaged).
🚀 Google Gemini Plugin Integration
You can now integrate Google’s Gemini API with Flyte using the new function_tool decorator to automatically convert Flyte tasks into Gemini agent tools. Both synchronous and asynchronous operations are supported.
import flyte
from flyteplugins.gemini import function_tool, run_agent

env = flyte.TaskEnvironment("gemini-agent")

@env.task
async def get_weather(city: str) -> str:
    return f"The weather in {city} is sunny."

# Run Gemini agent with a tool
async def agent_task(prompt: str):
    tools = [function_tool(get_weather)]
    return await run_agent(prompt=prompt, tools=tools, model="gemini-2.5-flash")
🔨 Forced Image Build Caching
You can now force a rebuild of images by setting force=True, which skips the existence check and rebuilds even if the image already exists. When using the remote image builder, this also sets overwrite_cache=True.
import flyte

image = flyte.Image("your_image")
result = await flyte.build.aio(image, force=True)
💻 LLM-Powered Code Generation
The new flyteplugins-codegen plugin generates code from natural language prompts, runs tests, and iterates in isolated sandboxes using LLMs.
from flyteplugins.codegen import AutoCoderAgent

agent = AutoCoderAgent(model="gpt-4.1", name="data-processor", resources=flyte.Resources(cpu=1, memory="1Gi"))

result = await agent.generate.aio(
    prompt="Process the CSV data to calculate total revenue and units.",
    samples={"sales": csv_file},
    outputs={"total_revenue": float, "total_units": int},
)
🔧 Updated AI Plugin Examples
Fixed and improved plugin examples for working with OpenAI and Anthropic in Flyte 2.0, using updated versions of flyteplugins-openai and flyteplugins-anthropic.
from flyteplugins.openai.agents import function_tool

agent_env = flyte.TaskEnvironment(
    "openai-agent",
    resources=flyte.Resources(cpu=1),
    secrets=[flyte.Secret(key="openai_api_key", as_env_var="OPENAI_API_KEY")],
)

@function_tool
@agent_env.task
async def get_bread() -> str:
    await asyncio.sleep(1)
    return "bread"
🔧 Debug Mode Integration
The Flyte SDK now supports a --debug flag to initiate tasks in VS Code debug mode from the CLI or Python interface. Specify debug=True in flyte.with_runcontext to attach a VS Code debugger during task execution.
import flyte

env = flyte.TaskEnvironment(name="debug_example")

@env.task
def say_hello(name: str) -> str:
    greeting = f"Hello, {name}!"
    print(greeting)
    return greeting

if __name__ == "__main__":
    flyte.init_from_config()
    run = flyte.with_runcontext(debug=True).run(say_hello, name="World")
    print(run.name)
    print("Run url", run.url)
    print("Waiting for debug url...")
    print("Debug url", run.get_debug_url())
✨ Improved CLI Enum Support
The Flyte CLI now supports EnumParamType, allowing you to pass enum names directly (e.g., --color=GREEN) instead of requiring internal values.
📝 Programmatic Log Access
You can now access logs programmatically using the get_logs() method on remote.Run and remote.Action. This returns an iterator over log lines with support for asynchronous processing via .aio(), filtering system-generated logs, and including timestamps.
⚡ Simplified PyTorch Example Setup
PyTorch environment setup is simplified: specify flyteplugins-pytorch directly via with_pip_packages instead of the internal PythonWheels API.
📈 Distributed Training Evaluation
Flyte now supports distributed training with callback-driven evaluation. EvalOnCheckpointCallback automatically triggers evaluation tasks after each training checkpoint, running evaluations in parallel with training and monitoring convergence. Upon convergence, a stop signal gracefully halts training.
⚡ Improved Benchmark Flexibility
The benchmark script for large I/O operations has been refactored. CPU and memory allocations are now parameterizable, file and directory tests can be run independently, and HTML report generation handles missing data gracefully.
💻 CLI Project Management
You can now create, update, and manage Flyte projects directly from the CLI, including setting IDs, names, descriptions, labels, and archive status.
# Example usage
flyte create project --id my_project_id --name "My Project" --description "Project description" -l team=dev -l env=prod
flyte update project my_project_id --archive
flyte get project --archived
🤖 Anthropic Claude Integration
You can now integrate Flyte tasks as tools for Anthropic Claude agents. Define tasks in Flyte and convert them into Claude tool definitions using the function_tool utility.
⏳ Panel App Enhancements
The Flyte SDK panel app now uses a threaded asynchronous execution model, so actions like code execution no longer block the interface. Reo.Dev tracking integration provides monitoring capabilities.
⚙️ AWS Config File Support
Flyte now supports S3 authentication via the AWS_CONFIG_FILE environment variable. When both AWS_PROFILE and AWS_CONFIG_FILE are set, Flyte uses a boto3-backed credential provider for profile-based authentication.
✨ Improved Task Execution Reliability
Flyte now automatically uses task.aio() for both synchronous and asynchronous tasks, ensuring consistent execution through the Flyte controller. The previous fallback to asyncio.to_thread() for synchronous tasks has been removed.
🔧 Enhanced Action Service Integration
You can now attach custom gRPC headers when interacting with the Actions service, enabling consistent request metadata for routing and integration in distributed environments.
🚀 Async Training with Early Stopping
A new ML pattern example runs asynchronous training with periodic evaluations using Flyte’s durable task management. The training task saves checkpoints asynchronously while evaluation tasks assess convergence, gracefully stopping training when convergence is detected.
async def train(checkpoint_dir: str, total_epochs: int, seconds_per_epoch: float) -> File:
    # Training logic
    pass

async def evaluate(checkpoint_file: File, eval_round: int, convergence_loss: float) -> bool:
    # Evaluation logic
    pass

async def main(total_epochs, seconds_per_epoch, convergence_loss, eval_interval_seconds, max_eval_rounds):
    # Orchestration logic
    pass
Use flyte run examples/ml/async_train_eval.py to execute this pattern locally.
🔧 Improved Include Path Handling
Flyte now correctly resolves include paths relative to the app directory during deployment. Previously, include paths that escaped the app script’s directory caused deployment failures due to invalid tar entries.
⚡ Enhanced Retry Management
Task retries during local runs now support exponential backoff and detailed tracking of retry attempts, allowing recovery from transient errors. Retry visibility is improved in both the controller logic and the terminal UI.
⚡ Improved Module Loading
The Flyte SDK’s module loading now respects .gitignore and standard ignore rules, excluding directories like .venv and __pycache__.
⚡ Dynamic Batching for Improved GPU Utilization
New DynamicBatcher and TokenBatcher classes allow concurrent tasks to share a single GPU, improving throughput for use cases like large-scale inference. An example demonstrates TokenBatcher for inference tasks with reusable containers.
✨ Run Cache Disabling
You can now disable run-level task result caching. When caching is disabled for a specific run, no cache hits are reported and cache operations are bypassed. The TUI reflects this with a clear indication that caching is disabled.
💻 Vim Key Navigation for TUI
The TUI (FlyteTUIApp and ExploreTUIApp) now supports Vim keys j and k for cursor movement in the ActionTreeWidget and RunsTable.
✨ Clickable Image Build URLs
Image URIs in TaskMetadata are now clickable in the Union frontend, linking directly to the Flyte run that built the image.
✨ Enhanced Run Filters
You can now filter runs and actions by project, domain, and creation/update time ranges. The new TimeFilter class supports filtering by created_at and updated_at timestamps, and filters are available through both the SDK and the CLI.
from flyte.remote import TimeFilter

# Example usage to fetch runs created after a specific date
runs = Run.listall(
    project="my-project",
    created_at=TimeFilter(after="2026-03-01")
)
🔧 Simplified Dependency Management
UVProject’s dependencies_only mode now copies only the pyproject.toml files of each editable dependency instead of the entire directory, reducing build context size and speeding up image builds.
🤖 MLE Agent Enhancements
Two new agents — the MLE Orchestrator Agent and the MLE Tool Builder Agent — use LLMs to automatically generate orchestration and processing code. They create, execute, and iteratively optimize ML models in an isolated sandbox environment with configurable computing resources.
✨ Improved Task Command Initialization
The Flyte CLI now initializes configuration when listing or resolving task commands via TaskPerFileGroup, preventing failures for config-dependent operations.
import flyte
from flyte.io import File

env = flyte.TaskEnvironment(name="example_env")

@env.task
async def test_file(project: str, input_file: File) -> str:
    return f"Got input {project=}, {input_file=}"
⚡ New Example Applications & Bug Fixes
New example applications added:
- Distributed training using async tasks
- MNIST model handling with PyTorch
- Agent workflows with LangGraph & Gemini API
Also includes a bug fix for scaling metric serialization.
⚙️ Phase Transitions Tracking
You can now view phase transition details for actions, showing time spent in each phase (QUEUED, INITIALIZING, RUNNING, etc.). Use the get_phase_transitions method and properties like queued_time and running_time to identify bottlenecks programmatically.
action = Action.get(run_name="my-run", name="my-action")
details = action.details()
transitions = details.get_phase_transitions()
for t in transitions:
    print(f"{t.phase}: {t.duration.total_seconds()}s")
🔧 Multiple Source Files Support
with_source_file now accepts a list of file paths, allowing multiple files in a single image layer. An error is raised if duplicate filenames target the same location.
from flyte._image import Image
from pathlib import Path

# Example usage with two different files
img = Image.from_debian_base(name="my-image").with_source_file([Path("a.py"), Path("b.py")])
📦 Simplified Code Bundling
The new with_code_bundle() method packages source code into Docker images. When copy_style is set to "none" in with_runcontext() or during flyte deploy, source code is automatically baked into the image. Use "loaded_modules" to include specific Python modules or "all" for entire directories.
🔧 Improved Error Messaging for Deployment
When using a src/ layout, the “Duplicate environment name” error during deployment now hints at the --root-dir option to help resolve dual-import issues.
# New deployment configuration example
flyte deploy --dry-run --recursive --root-dir src src/my_module
🔧 Improved Debugging for Reusable Tasks
Reusable tasks now automatically disable debugging. Previously, debugging was enabled by default, which could cause issues with reusable tasks.
✨ JSONL Plugin Support
The new JSONL plugin adds JsonlFile and JsonlDir types for Flyte workflows. It supports async and sync read/write operations with optional zstd compression, using orjson for fast serialization.
from flyteplugins.jsonl import JsonlFile, JsonlDir

# Example usage of JsonlFile
@env.task
async def process_file(f: JsonlFile):
    async for record in f.iter_records():
        print(record)

# Example usage of JsonlDir for sharded directories
@env.task
async def process_dir(d: JsonlDir):
    async for record in d.iter_records():
        print(record)
February 2026
✨ JSON Schema Enhancement
Flyte now accurately converts Python types to JSON Schemas by leveraging Flyte’s internal type system. Previously, certain types like Literal["C", "F"] were incorrectly mapped. Now, input schemas for Flyte tasks reflect precise JSON Schemas, improving integrations with tools like Anthropic’s Claude.
# Example: Converting Literal to JSON Schema correctly
def my_func(unit: Literal["C", "F"]) -> str:
    return unit

schema = NativeInterface.from_callable(my_func).json_schema
assert schema["properties"]["unit"] == {"type": "string", "enum": ["C", "F"]}
:calculator: Panel Calculator Example
A new example showcases a calculator app embedded in a Panel interface using Flyte’s AppEnvironment, demonstrating how to build interactive web-based UIs with Flyte.
✨ Spark Plugin Update
The flyteplugins-spark dependency has been updated to >=2.0.0, moving away from pre-release versions.
🔒 Secure Package Specification
Package version constraints like apache-airflow<=3.0.0 are now automatically quoted in generated Dockerfiles. Previously, unquoted constraints could cause incorrect shell interpretation and build failures.
⚡ Enum Name Acceptance in CLI
The Flyte CLI now accepts enum names as valid inputs. Previously, only enum values were accepted, so --color=RED would fail when the value was "red". Both names and values are now accepted.
import enum
import flyte

class Color(enum.Enum):
    RED = "red"
    GREEN = "green"
    BLUE = "blue"

@flyte.task
def example_task(color: Color):
    return f"Selected color is {color.name}"
🔧 Enhanced Pod Template Handling
Pod templates are now properly maintained across task overrides. Previously, overriding certain task attributes could inadvertently discard custom pod templates. Pod specifications, labels, and annotations now persist even after renaming tasks or modifying other properties.
⚡ Stress Testing Example Added
A new stress testing example demonstrates a fan-out execution pattern, creating a dynamic tree of asynchronous tasks to simulate high concurrency. You can control the number of tasks spawned at each layer and introduce variability with a jitter parameter.
🐛 Correct Serialization Field
Fixed a bug in the serialization of scaling metrics: the correct field target_value is now used instead of val. This ensures proper serialization for Scaling.Concurrency and Scaling.RequestRate metrics as expected by the protobuf definitions.
🔧 Improved Async Task Handling
Async Flyte tasks now route execution through task.aio(), ensuring consistent invocation through Flyte’s controller and correct handling of nested async tasks.
🔧 Sync Alignment of File Upload Methods
File.from_local_sync and File.from_local now handle filenames consistently when uploading to remote storage. Previously, the sync and async methods could produce different filenames for the same upload.
# Example of uploading a file with consistent naming:
import flyte

with tempfile.TemporaryDirectory() as temp_dir:
    local_path = os.path.join(temp_dir, "source.txt")
    remote_path = os.path.join(temp_dir, "destination.txt")

    # Ensure the file content
    with open(local_path, "w") as f:
        f.write("sample content")

    # Upload the local file to a remote location
    uploaded_file = File.from_local_sync(local_path, remote_path)

    print(f"Uploaded file path: {uploaded_file.path}")
⌛ Request Timeout Configuration
You can now configure request timeouts for Flyte applications using the new Timeouts dataclass. Set a request timeout (as an integer or timedelta) to limit the maximum duration a request can take within an application environment.
🔧 Enhanced Bundling and Error Handling
Flyte now ignores .git directories in deployment code bundles, reducing artifact size and improving deployment speed. Additionally, explicit error handling for the copy_style parameter provides clear guidance when bundling is unnecessary.
🔧 Dynamic Pydantic Model Creation
The new PydanticTransformer.guess_python_type method dynamically creates Pydantic models from JSON schema metadata. This handles cases where the original Pydantic model class isn’t available, enabling flexible deserialization of complex nested structures.
👥 Human-in-the-Loop Plugin
The new Human-in-the-Loop (HITL) plugin enables workflows to pause and wait for human input via a web interface or programmatically. Create events that prompt for human interaction through an auto-served FastAPI app.
import flyteplugins.hitl as hitl

# Create event and wait for human input
event = await hitl.new_event.aio(
    "input_event",
    data_type=int,
    scope="run",
    prompt="Enter a number"
)
value = await event.wait.aio()
🚀 Stateless Code Sandbox
Flyte now supports running arbitrary Python code and shell commands in an isolated, stateless Docker container with the flyte.sandbox.create() API. Three execution modes are available: Auto-IO, Verbatim, and Command, each handling inputs and outputs differently while running code in fresh, ephemeral containers.
🔧 Improved CLI Logging Initialization
The Flyte SDK now ensures a consistent logging setup when using the CLI. Previously, CLI commands would initialize configuration multiple times, leading to duplicated log entries. Now:
- Initialization occurs once per command execution.
RichHandleris enabled from the start, so all logs display in rich format.- The
hello.pyexample script now has a default value, so it runs without arguments.
@env.task
def main(x_list: list[int] = [1, 2, 3, 4, 5, 6, 7, 8, 9, 10]) -> float:
    x_len = len(x_list)
    if x_len < 10:
        raise ValueError(f"x_list doesn't have a larger enough sample size, found: {x_len}")
    y_list = list(flyte.map(fn, x_list))
    y_mean = sum(y_list) / len(y_list)
    return y_mean
🔧 Enhanced Ignore Handling
Flyte SDK now skips processing of .gitignore and .flyteignore files inside commonly ignored directories such as .venv or __pycache__, avoiding redundant file processing.
🐳 CI Image Builder
A new example script automates Docker image building and pushing from CI. Configure it with your source and target image details to integrate with continuous deployment pipelines.
🔧 TypedDict Compatibility Fix
The Flyte SDK now correctly handles TypedDict for Python versions earlier than 3.12 by using typing_extensions.TypedDict.
# Importing TypedDict based on Python version
import sys
if sys.version_info >= (3, 12):
    from typing import TypedDict
else:
    from typing_extensions import TypedDict
🌐 Cross-Platform Code Bundling
The Flyte SDK now uses POSIX-style paths for file hashing and tarball creation, ensuring consistent code bundling behavior across Windows and Unix systems.
🔧 Improved CLI JSON Formatting
The flyte CLI now uses the to_dict() method when available for JSON output, fixing TypeError failures that occurred with certain non-iterable object types.
🔧 Improved Pod Image Handling
Flyte now consistently merges container images when using a pod template. The primary container uses app_env.image if no explicit image is set, with correct handling of both "auto" and specific image values.
✨ Flyte Webhook Environment
A pre-built Flyte webhook environment makes it easier to integrate with FastAPI endpoints for common Flyte operations like running tasks, managing apps, and handling triggers. This update uses httpx for HTTP requests and expands endpoint exports for better customization.
🔁 Retry Interceptor for gRPC
A new retry interceptor for gRPC channels allows you to define how many times a gRPC call should be retried on transient failures. Specify the number of retry attempts using the rpc_retries option during channel creation.
✨ Orchestration Sandbox Feature
Flyte 2.0 now supports dynamic orchestration within a sandbox using flyte.sandbox.orchestrator_from_str(). Create reusable orchestration templates directly from Python code strings without defining decorated functions — useful when code is dynamically generated from UIs or language models.
🔧 Task Shortname Override Fix
You can now override the shortname for tasks in the UI by setting the short_name parameter in task overrides. Previously, overridden shortnames were not reflected in the Flyte UI.
✨ NVIDIA H100 GPU Support
Flyte now supports NVIDIA H100 GPUs with various MIG partitions for fine-grained resource allocation.
from flyte import GPU, Resources

h100_mig_env = flyte.TaskEnvironment(
    name="h100_mig",
    resources=Resources(
        cpu="1",
        memory="4Gi",
        gpu=GPU(device="H100", quantity=1, partition="1g.10gb"),
    ),
)
⚡ Enhanced Error Handling in PyTorch Elastic Jobs
Flyte’s PyTorch integration now includes configurable NCCL timeout settings to better manage CUDA out-of-memory (OOM) situations. This prevents elastic jobs from hanging due to OOM by introducing faster failure detection and customizable restart policies. You can reduce timeout durations, enable asynchronous error handling, and activate built-in monitoring.
🔧 Reverse Path Priority Fix
The Flyte SDK’s handling of sys.path when running tasks remotely now respects local path priority. Previously, the entrypoint directory could override top-level packages. This fix ensures consistent path prioritization between local development and remote execution.
🌐 S3 Virtual Hosted-Style Support
You can now specify the addressing style for S3-compatible backends by setting the FLYTE_AWS_S3_ADDRESSING_STYLE environment variable to virtual. This constructs URLs in the format https://<bucket>.<endpoint>/<key>, enabling compatibility with more storage providers.
November 2025
⏩ Grouped Runs
We redesigned the Runs page to better support large numbers of runs. Historically, large projects produced so many runs that flat listings became difficult to navigate. The new design groups Runs by their root task - leveraging the fact that while there may be millions of runs, there are typically only dozens or hundreds of deployed tasks. This grouped view, combined with enhanced filtering (by status, owner, duration, and more coming soon), makes it dramatically faster and easier to locate the exact runs users are looking for, even in the largest deployments.
🌐 Apps (beta)
You can now deploy apps in Union 2.0. Apps let you host ML models, Streamlit dashboards, FastAPI services, and other interactive applications alongside your workflows. Simply define your app, deploy it, and Union will handle the infrastructure, routing, and lifecycle management. You can even call apps from your tasks to build end-to-end workflows that combine batch processing with real-time serving.
To create an app, import flyte and use either FastAPIAppEnvironment for FastAPI applications or the generic AppEnvironment for other frameworks. Here’s a simple FastAPI example:
from fastapi import FastAPI
import flyte
from flyte.app.extras import FastAPIAppEnvironment

app = FastAPI()
env = FastAPIAppEnvironment(
    name="my-api",
    app=app,
    image=flyte.Image.from_debian_base(python_version=(3, 12))
        .with_pip_packages("fastapi", "uvicorn"),
    resources=flyte.Resources(cpu=1, memory="512Mi"),
    requires_auth=False,
)

@env.app.get("/greeting/{name}")
async def greeting(name: str) -> str:
    return f"Hello, {name}!"

if __name__ == "__main__":
    flyte.init_from_config()
    flyte.deploy(env) # Deploy and serve your app
For Streamlit apps, use the generic AppEnvironment with a command:
app_env = flyte.app.AppEnvironment(
    name="streamlit-hello-v2",
    image=flyte.Image.from_debian_base(python_version=(3, 12)).with_pip_packages("streamlit==1.41.1"),
    command="streamlit hello --server.port 8080",
    resources=flyte.Resources(cpu="1", memory="1Gi"),
)
You can call apps from tasks by using depends_on and making HTTP requests to the app’s endpoint. Please refer to the example in the
SDK repo. Similarly, you can call apps from other apps (see this
example).
🏷️ Custom context
You can now pass configuration and metadata implicitly through your entire task execution hierarchy using custom context. This is ideal for cross-cutting concerns like tracing IDs, experiment metadata, environment information, or logging correlation keys—data that needs to be available everywhere but isn’t logically part of your task’s computation.
Custom context is a string key-value map that automatically flows from parent to child tasks without adding parameters to every function signature. Set it once at the run level with with_runcontext(), or override values within tasks using the flyte.custom_context() context manager:
import flyte

env = flyte.TaskEnvironment("custom-context-example")

@env.task
async def leaf_task() -> str:
    # Reads run-level context
    print("leaf sees:", flyte.ctx().custom_context)
    return flyte.ctx().custom_context.get("trace_id")

@env.task
async def root() -> str:
    return await leaf_task()

if __name__ == "__main__":
    flyte.init_from_config()
    # Base context for the entire run
    run = flyte.with_runcontext(custom_context={"trace_id": "root-abc", "experiment": "v1"}).run(root)
    print(run.url)
🔒 Secrets UI
Now you can view and create secrets directly from the UI. Secrets are stored securely in your configured secrets manager and injected into your task environments at runtime.
Image builds now run in the same project-domain
The image build task is now executed within the same project and domain as the user task, rather than in system-production. This change improves isolation and is a key step toward supporting multi-dataplane clusters.
Support for secret mounts in Poetry and UV projects
We added support for mounting secrets into both Poetry and UV-based projects. This enables secure access to private dependencies or credentials during image build.
import pathlib

import flyte

env = flyte.TaskEnvironment(
    name="uv_project_lib",
    resources=flyte.Resources(memory="1000Mi"),
    image=(
        flyte.Image.from_debian_base().with_uv_project(
            pyproject_file=pathlib.Path(__file__).parent / "pyproject.toml",
            pre=True,
            secret_mounts="my_secret",
        )
    ),
)
October 2025
♾️ Larger fanouts
You can now run up to 50,000 actions within a run and up to 1,000 actions concurrently. To enable observability across so many actions, we added group and sub-actions UI views, which show summary statistics about the actions which were spawned within a group or action. You can use these summary views (as well as the action status filter) to spot check long-running or failed actions.
💻 Remote debugging for Ray head nodes
Rather than locally reproducing errors, sometimes you just want to zoom into the remote execution and see what’s happening. We directly enable this with the debug button. When you click “Debug action” from an action in a run, we spin up that action’s environment, code, and input data, and attach a live VS Code debugger. Previously, this was only possible with vanilla Python tasks. Now, you can debug multi-node distributed computations on Ray directly.
⚡ Triggers and audit history
Triggers let you templatize and set schedules for your workflows, similar to Launch Plans in Flyte 1.0.
@env.task(triggers=flyte.Trigger.hourly())  # Every hour
def example_task(trigger_time: datetime, x: int = 1) -> str:
    return f"Task executed at {trigger_time.isoformat()} with x={x}"
Once you deploy, it’s possible to see all the triggers which are associated with a task:
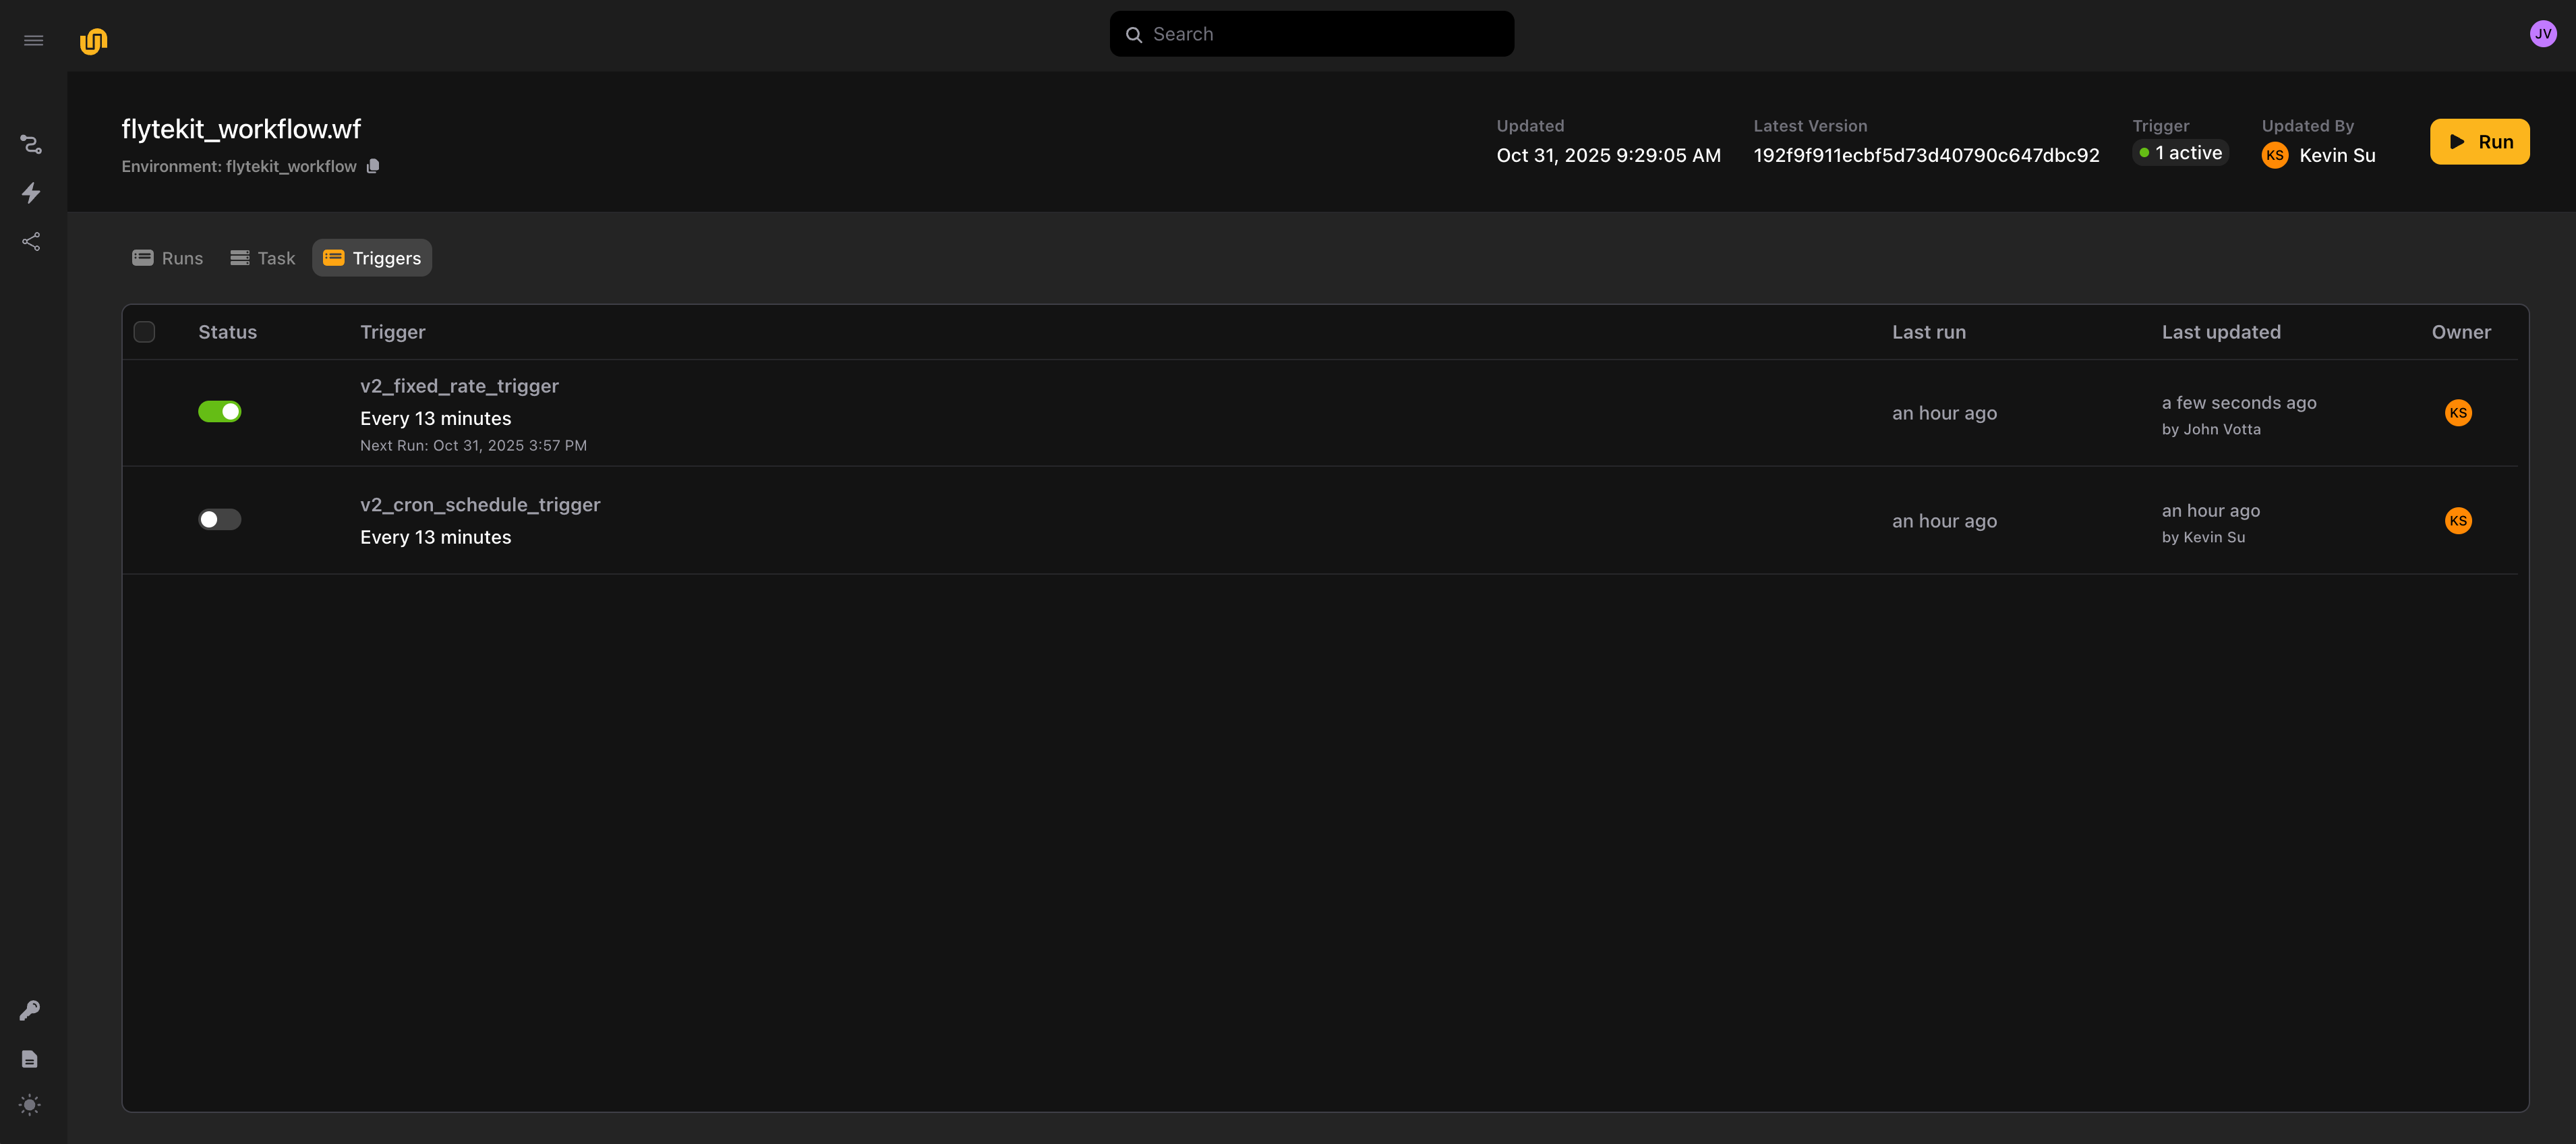
We also maintain an audit history of every deploy, activation, and deactivation event, so you can get a sense of who’s touched an automation.
⬆️ Deployed tasks and input passing
You can see the runs, task spec, and triggers associated with any deployed task, and launch it from the UI. We’ve converted the launch forms to a convenient JSON Schema syntax, so you can easily copy-paste the inputs from a previous run into a new run for any task.